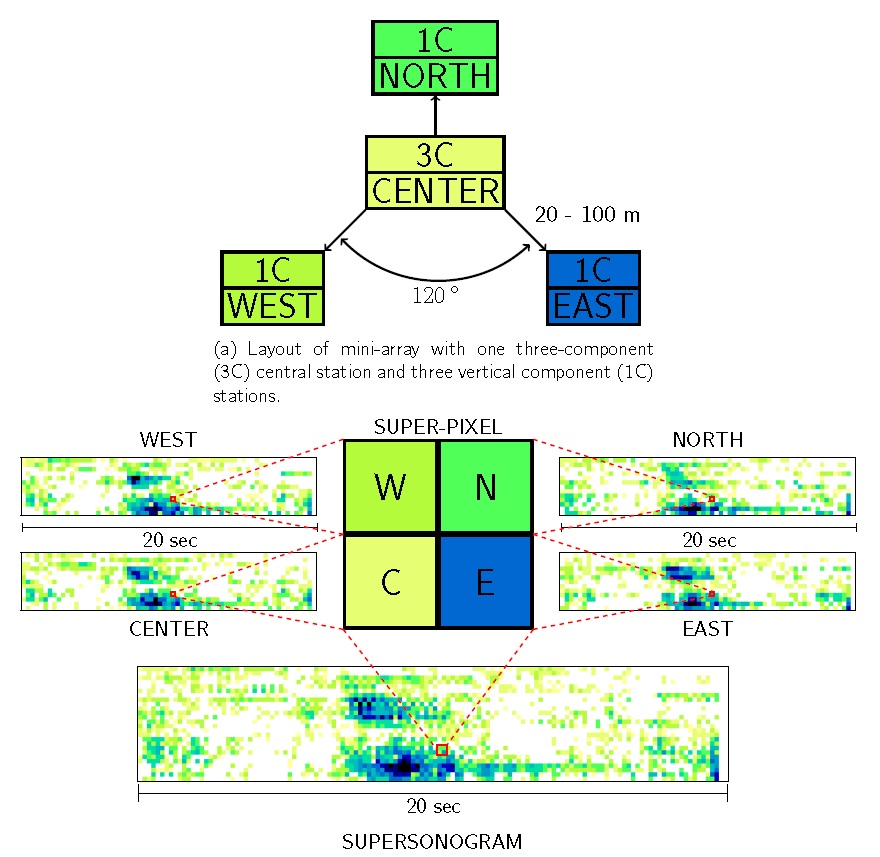
Single stations of one mini-array are usually within 200 meters of distance which makes it possible to combine the four vertical traces of one mini-array into a so called super-sonogram. The combination is done by using “super-pixels” at each time and frequency position. The horizontal traces of the three component stations are used later for the more detailed interpretation of signals. Each “super-pixel” of the super-sonogram consists of four pixels, each from one vertical trace of the mini-array. The figure below shows how pixels of four sonograms create one “super-pixel” which is then used in the super-sonogram.
The super-sonogram visualization adds additional advantages to the array processing methods, e.g. to estimate back-azimuth and apparent velocity. The visualization helps out in the pure detection and differentiation of events from noise with fast coherence checks and acts as a preprocessing before events are inspected more thoroughly with beam-forming and localization. E.g. array-wide signal coherence can be checked very fast by looking just at one trace. Incoherent signals show up as spotted patterns while coherent ones create consistent areas of similar color. Furthermore, the amount of data which can be displayed on one screen increases significantly. Super-sonograms can be displayed on screen with a very small dimension and events are still prominent to an analyst. Additionally, faulty or very noisy data of single stations can be recognized immediately in comparison with other stations of the same array.
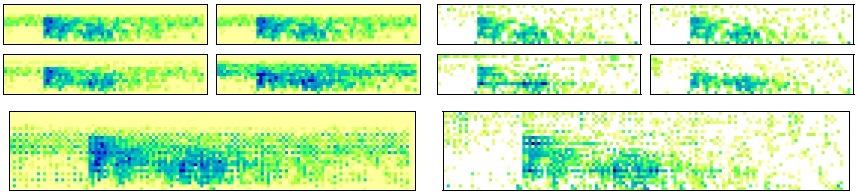
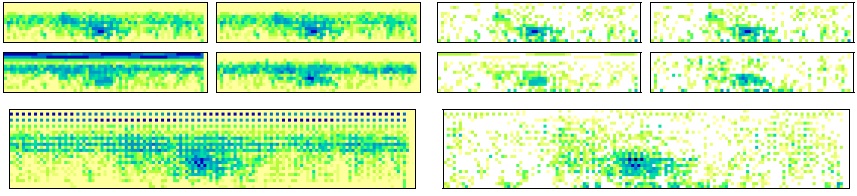
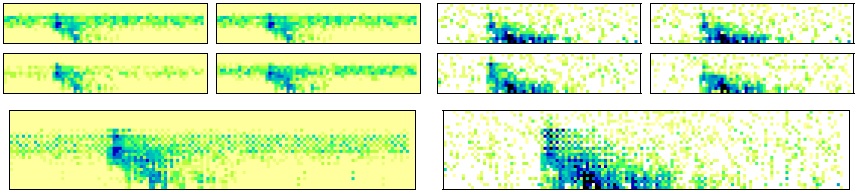
Comparison of super-sonogram compilation of standard spectrograms without signal enhancing sonogram steps versus sonograms
Tests with common spectrograms show that the combination of traces from different stations into one trace is only possible with the signal processing steps of the sonogram calculation. On the other hand, if regular spectrograms are combined to a super-sonogram, the varying noise conditions at each single station show up dominantly and obfuscate events. Low-SNR signals are not visible without the enhancements. With sonograms, the onset times of events get significantly clearer by better contrasts of pre and post onset time signals as well as e.g. the extension of low frequency parts of an impulsive i.e. broadband onset.
The figures below illustrate the comparison of super-sonogram compilation of common spectrograms without signal enhancing sonogram steps (left) versus sonograms (right). Figures consist of the four spectrograms/sonograms plus the resulting super-sonogram on the respective bottom.