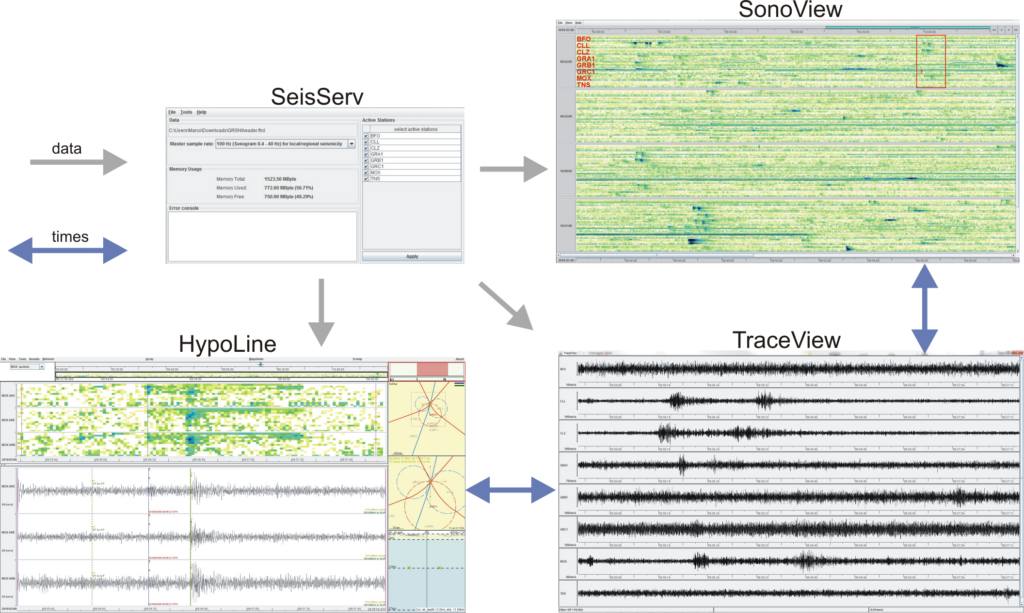
The super-sonogram technique is integrated in a software suite called NanoseismicSuite which consists of four modules: SeisServ, SonoView, TraceView and HypoLine.
SeisServ
SeisServ reads seismic data and meta-data in the Center for Seismic Studies (CSS) or MiniSEED format from files or an Oracle database. It provides this data to the other modules and allows editing of the meta-data, e.g. the geometry of seismic stations.
SonoView
After loading the data, SonoView is the first application to use in a typical event screening scenario. It visualizes super-sonograms in a manner to maximize the visible data on one screen. An arbitrary amount of mini-arrays and time spans can be loaded. An analyst can scroll fast through the continuous data in SonoView and mark suspicious events for further processing steps. The Demo version of SonoView is available now!
TraceView
Selected events from SonoView can be further analyzed inTraceView which visualizes the respective seismogram of the selected stations. TraceView allows to get an overview of the seismic network to analyze the quality of the recorded event. Basic filters and scalings can be applied to the seismograms.
HypoLine
The last application in the processing pipeline of the NanoseismicSuite is HypoLine which is used for the localization and magnitude determination of events. Accurate three-dimensional underground models of the measurement area are often unknown a priori and localization is done by time difference of arrival (TDOA) hyperbolae and S-P distance circles based on one-dimensional velocity models. HypoLine allows a localization and identification with interactive and graphical techniques for very weak events, where the influence of each parameter to event-location is displayed in real-time resulting in the most plausible solution.